Put Trainees on Search Committees!

13 February 2016 - Last Updated 13 February 2016

Right now, the hashtag #ASAPBio is making waves on twitter as the meeting of the same name approaches. Scientists are eager to move towards preprinting, open access, and post-publication peer review in order to shed some of the major issues that the current journal publishing system poses for modern scientific communication. I personally am very much in favor in particular of preprinting as an evolutionary rather than revolutionary step in the right direction, but some faculty (among them my advisor) are increasingly pushing to avoid the pitfalls of the glamour journals altogether. They are running into a surprising voice of opposition: trainees who, somewhat justifiably, think that if they don’t try to “play the game” to get high-impact CNS papers, they are unlikely to be able to achieve success in their quest to ultimately get jobs. They make the argument that faculty job searches are reliant on big-name journals on a CV, and without at least one, they won’t be able to separate themselves from the ~400 other applicants in an average job search. With 400 candidates, reading even two papers per candidate could easily bog down a search committee in thousands of hours of work, and they know that it is much easier to filter heavily by those big-name journals to find only the “top” candidates to evaluate further. The responses have largely been saying that good faculty searches do go beyond that and do look at the applications themselves to judge candidates (with an estimated time of 20 minutes per application, this would suggest approximately 133 hours of total work), with the work divvied amongst the members of the committee so that it does not bog down any one scientist. The responses to this have been mixed, with some seeing this as a reasonable point and others continuing to believe that the system selects against those who aren’t publishing in the big-name journals.

A big part of the problem is that those trainees who hope to one day become faculty have often not gotten a chance to be a part of a faculty search. From the outside looking in, its easy to see the candidates coming to give job talks, the majority of whom do have major publications, and assume that that is what is required for them to eventually be in the same position. No matter what faculty say about their search process, ultimately the hiring process is from the outside a black box which encourages trainees to try to check all the boxes to improve their chances. Mike Eisen recently proposed in his “Mission Bay Manifesto” that scientists commit to not using journal titles in evaluation as a way of avoiding this kind of game, but it is hard to not feel like these factors remain important without knowing what is actually held as important behind the closed doors of the search committee. If the established scientists pushing for these changes to improve transparency in scientific publishing want to get trainees fully onboard, there needs to be a concerted effort to improve the transparency of the hiring side of the academic community.

To this end, I think the easiest and most straightforward solution is to begin including trainees on search committees. I would propose starting by putting one student and one postdoc on each search committee. This will benefit the search process by providing a perspective which is usually not taken into consideration during faculty search (but one that I would contend is very important - the prospective employees of a faculty candidate!), and it would also provide trainees with the opportunity to see what a successful application looks like. The educational benefit seems clear to me: with the opportunity to see hundreds of applications ranging in quality, anyone interested in pursuing academic faculty positions can get a better idea of what is expected of them. I think just as important is the cultural impact of this change. The ability of trainees to participate in searches will eliminate some of the superstitions that arise and help foster a better sense of ownership for trainees at an institution.

read more
EMRinger is published!

24 August 2015

Earlier this year, I posted about my first project with the Fraser lab, which resulted in the tool EMRinger. The paper came out last week as a brief communication in nature methods under the title “EMRinger: side chain–directed model and map validation for 3D cryo-electron microscopy” (doi: 10.1038/nmeth.3541/pmid: 26280328).

This was my first time going through the peer review process, and for the most part it went smoothly. That said, it took 6 months for what was a positive review process to result in a publication! Thankfully, we preprinted the paper on biorxiv, so the work was publicly available during that time. I also gave 2 talks on EMRinger in the intervening months, at the Bay Area Cryo-EM symposium and as a selected poster presentation at the 3DEM Gordon Conference. Having the preprint was very nice for being able to easily send our manuscript to people that were interested in learning more. I have more thoughts about the preprinting experience, but I will probably break those off into a separate post where I can focus solely on my experiences with it and plans for the future.

read more

EMRinger: a side-chain-directed approach to study model-to-map agreement in cryo-EM

17 February 2015

For the past year, I have been working in the Fraser Lab on developing an analysis framework, which we call EMRinger, for doing model-to-map validation in the burgeoning field of near-atomic-resolution single particle electron cryomicroscopy (cryo-EM). We recently submitted our paper for review; at the same time, we preprinted it in bioRxiv (doi: 10.1101/014738) and open sourced the code. We hope that even as the article undergoes the peer review process, the tool will be available for scientists hoping to get an independent metric for progress in their refinement. We also hope people will be able to start including it as a “Table 1” metric now that the code and the manuscript are available. We have already been using EMRinger with our collaborators for a few months, and we are excited to see how it gets used now that it is out in the wild!

The manuscript is the best place to get scientific details about the work, but I am writing this post to talk informally about the method, as well as the process of developing it and the preprinting experience.

read more

Syntax Highlighting for Pymol Scripts

26 August 2014

snippet.png

The Fraser lab makes most of its figures that represent protein structure and electron density in Pymol, which in my experience seems to be the most popular molecular graphics software for crystallography. One of the great things about pymol is the ability to write scripts to reproducibly create the same figure, as well as being able to write loops to perform tasks iteratively. A few members of our lab excel at writing these pml files, and spend a fair amount of time working with them.

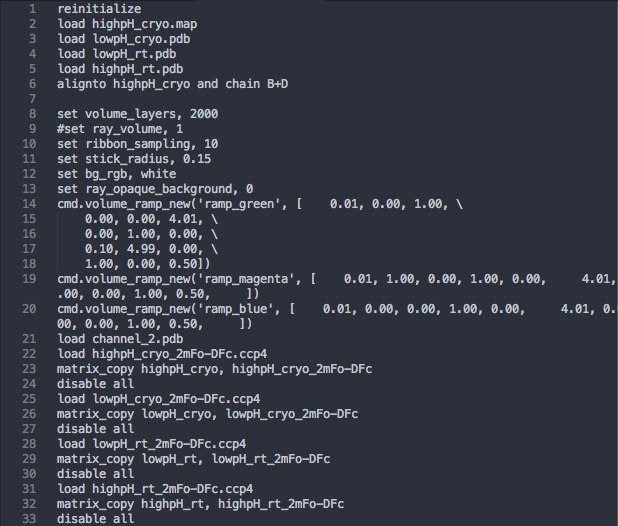
When editing the files, they look like this:

unhighlighted code

They are treated as plain text; there is no indication of what the different parts of the code mean, which makes it much more difficult to parse the meaning of each part of the code in my experience. I am sure that for people more familiar with pymol, this is no longer problematic, but for me it was a stumbling block. To fix this, I wrote a language grammar to allow for syntax highlighting of pymol files in sublime text. You can find the result at my Github or download the final product for sublime text through Package Control. I recommend the package control version because it will update automatically as I add improvements over time. You can read about the process and see the final product in more detail below.

read more

Making Publication-quality Charts using Python and Matplotlib

20 August 2014

Before updating the matplotlibrc

Python is currently my programming language of choice. It is the programming language taught by my graduate program to incoming first years, and in my experience it is the most common scripting language used by the scientists around me.

Because of this, when I want to work with data my first instinct is to go to python. Python is very effective for importing data, doing all of the manipulations necessary, and performing statistical tests. Ultimately, while I am aware that there are a multitude of other tools available, I would rather stick with python.

In my experience, the most painful part of using python for data analysis is visualization. Plotting in python is primarily accomplished via Matplotlib. I find the syntax fairly straightforward, but the default output of the charts leave much to be desired. In particular, I find myself messing with the spacing between the labels and the graph, the size of the labels and title, the linewidth, the colors of the objects, and the visual appearance of the regular tickmarks all to make a single figure look appealing enough to share with my peers. Trying to do this consistently is even more maddening, as it ultimately results in even more boilerplate code.

I ultimately (mostly) solved this problem by creating a matplotlibrc file which automatically imports a number of settings for every chart I choose to work with. My matplotlibrc file lives in a github repository where you can freely grab and modify it. Just put it in your ~/.matplotlib/ folder. I also thought I would use this space to talk about the decisions I made in designing the matplotlibrc to get as close as possible to publication quality images with no special styles in the python code.

read more